Learn how to describe a table chart for IELTS Academic task 1. Find out how to summarise, group and divide the table chart data.
We are going to show you how to ace the IELTS academic writing task 1 so that you’ll be able to craft a compelling, well thought-out answer when you are faced with an IELTS Academic question asking you to compare and summarise table chart data in the IELTS exam.
After reading this article you’ll be confident reading and understanding data for the IELTS table chart task 1 and then you will be able to accurately describe it in an easy-to-understand manner that the IELTS examiners will love.
Let’s go through the main points that will help you on your road to describing an IELTS writing task 1 table in no time.
1. Summarise the table
Every IELTS table question tells you to do the same things.
You describe the information by selecting and reporting the main features.
This is a very important skill and is arguably the focus of the entire task. Here are some IELTS writing task 1 examples Look at the figures in the table and the tense of the data. Is it the past, is it the present or does it predict future trends?
Also, look at the data and make a list of any IELTS table description vocabulary that you will need to use to explain yourself effectively. Think about what you can paraphrase too. For example, could you use ‘literacy’ in your answer?
2. Divide the data
This is a key tip for IELTS writing task 1! Data can be a challenge to handle. Split the data into manageable pieces that you can group. That way you can explain it better because you can understand it better.
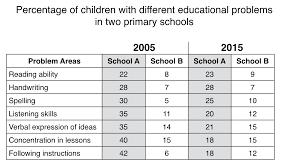
In the above task 1 example, the data has been divided into two significant groups. This makes it easier to understand and describe.
You can also look for exceptions in the data which is where something interesting happens or is something that stands out for you. This helps you get started describing the data and the information you can see.
Every table is different, and there’s never only one way to divide the data. For
You can see a task 1 model answer below to help you.
3. Model Answer
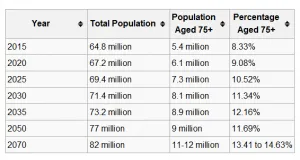
This table compares the UK’s 55-year projected growth of the number of people over the age of 75 with that of the total population. Overall, we can expect the number of people aged over 75 to double by 2070.
It is estimated that in the 20 years from 2015, the total population of the UK will grow by almost 10 million, from 64.8 million in 2015 to 73.2 million in 2035. The number of over 75’s will also increase significantly, from 5.4 million (2015) to 8.9 million (2035), which is an increase of nearly 4%.
The estimated figures for 2050 and 2070 indicate that this trend will continue, and the total population will be as high as 82 million by 2070. Although the number of people aged 75 or older will remain relatively stable between 2035 (8.9 million) and 2050 (9 million), the number will continue to swell and by 2070 nearly 15% of the population (11 – 12 million) will be aged 75 or older.
4. Make your point clearly
How you structure your task 1 answer can help set the overall flow of your answer. Usually, two main paragraphs will be used so that you can describe each group of data. That means that one group of data would be described in one paragraph whilst the second group of data would be a new paragraph.
This keeps things organised and helps you keep track of your overall point.
Task 1 top tip – remember it’s always ‘the number of’ for countable nouns and ‘the amount of’ for uncountables.
The number of people increased
The amount of rice increased.
Don’t mix them up!
5. Compare & contrast with exceptions
For example, the first paragraph could be comparing the data whilst the second paragraph is talking about this in more detail, whilst a final summary sentence ties it all nicely.
This helps you stay on track and easily cover all the IELTS task 1 bases too.
Still not sure? Let’s go through an example.
Introductory statement – explain what you are going to compare.
Paragraph 1 – Comparison – Describe and compare the data groups and any exceptions you can see in the table.
Summary sentence – An overall sentence about the table that ties everything together and talks about anything significant from paragraphs 1 and 2.
Let’s see how it looks compared to a model answer.
6. Writing task 1 table model answer analysis
– Introduction
This table compares the UK’s 55-year projected growth of the number of people over the age of 75 with that of the total population.
– Paragraph 1
It is estimated that in the 20 years from 2015, the total population of the UK will grow by almost 10 million, from 64.8 million in 2015 to 73.2 million in 2035. The number of over 75’s will also increase significantly, from 5.4 million (2015) to 8.9 million (2035), which is an increase of nearly 4%. The estimated figures for 2050 and 2070 indicate that this trend will continue, and the total population will be as high as 82 million by 2070. -Although the number of people aged 75 or older will remain relatively stable between 2035 (8.9 million) and 2050 (9 million), the number will continue to swell and by 2070 nearly 15% of the population (11 – 12 million) will be aged 75 or older.
– Summary Sentence
Overall, we can expect the number of people aged over 75 to double by 2070.
Let’s break it down some more, using the model answer above.
The introduction talks about what the table shows and explains the groups that will be compared. In this case, it is two groups within the first group of 20 years.
Paragraph 1 takes a closer look at the second group of 20 years and the data that shows. It also acknowledges the exception shown in the graph.
The summary sentence describes something significant and relates to both paragraphs and ties everything together.
So, using our model answer above, this could be during the time period the number of people over 75 doubled.
7. Points to remember – writing task 1
-
Don’t include your own opinion or any information that is not asked for.
-
Don’t include too many figures in your writing task 1 table answer.
-
Don’t forget to have a plan to structure the answer correctly.
8. Be a master essay writer and prepare fully for writing task 1 with these tips
-
Use practice tests – the more experience, the better!
-
Review sample essays, such as these here.
-
Time yourself as you practice more and more.
-
Try answering the question without using a dictionary.
-
Click here for more help with your IELTS academic task 1
19 IELTS writing task 1 table vocabulary phrases
Warning: Use these in context.
-
An inspection of the data in the first table clearly shows
-
It is apparent from this table that considerable …
-
In the third column, there is a distinct trend of …
-
What stands out in the table is …
-
A closer inspection of the table shows …
-
As the table shows, there is a significant decrease …
-
There is a significant difference between column A and column B, most notably…
-
An inspection of the data in the table reveals that …
-
What stands out in this table …
…is the general pattern of …
… is the difference between …
… is the wide disparity between …
… is the rapid increase of …
… is the growth of …
…is the high rate of
High-level sentences
-
The figure for 1999 is almost three times that of 2010.
-
The figure for 2011 is exactly four times that of 2010.
-
It is clear that the figures between 2001 and 2010 are broadly in the same range.
Grouping
The figures between 1999 and 2000 are very similar to those of the prior year. The figures in columns A and B are almost identical.
Have a look at some more IELTS writing task tutorials.
Video tutorial: IELTS Academic Task 1 – How to Describe a Table
Take a look at the full video tutorial here:
More useful IELTS Academic Task 1 lessons
-
- IELTS Writing Task 1 Vocabulary List With Examples
- How to describe a pie chart
- Bar Chart IELTS
- How to describe a map
- Describe an image
- Describe a natural process
- How to describe a table
- How to paraphrase
- Line graph sample answer
- Marking criteria for Task 1
- Map vocabulary for IELTS Task 1
- How to describe a flow chart
- Essential skills for Task 1
- How to get band 9 for academic task 1
- How to describe a process diagram
- Academic task 1: sentences and grammar to describe a chart